Python Tools for Research
Developed python packages for data analysis. Source code is available at Github.
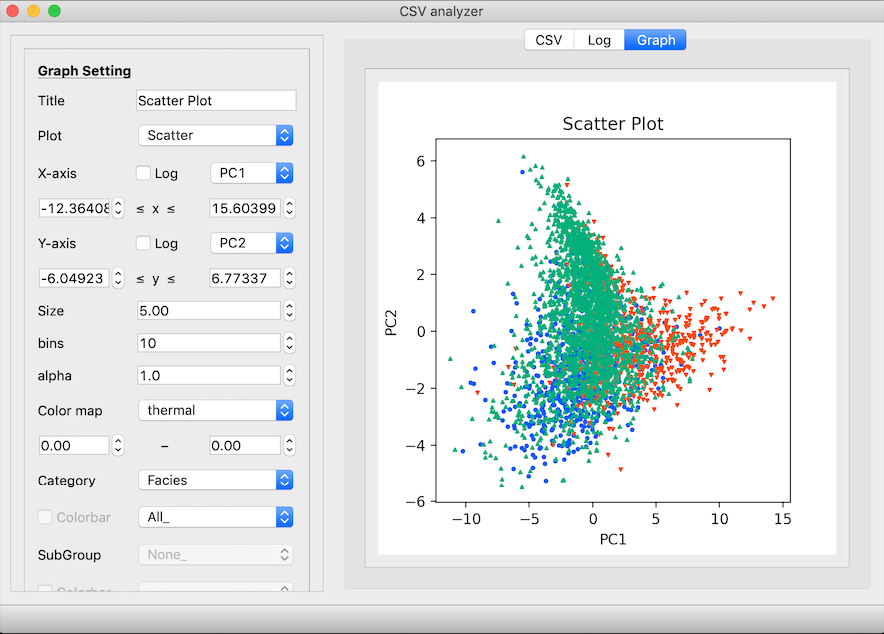
sview-gui
PyQt5 GUI for data visualisation of csv file or pandas’ DataFrame. This GUI is based on the matplotlib and you can visualize your csv file in various ways. Here are the main features;
Scatter, line, density, histgram, and box plot for visualisation your csv; Detail setting for the marker size, line width, number of bins of histgram, color map (from cmocean); Save figure as editable PDF; Source code of the graph you plotted are recorded in the log window
efshape is available at PyPI
Source code is available at Github
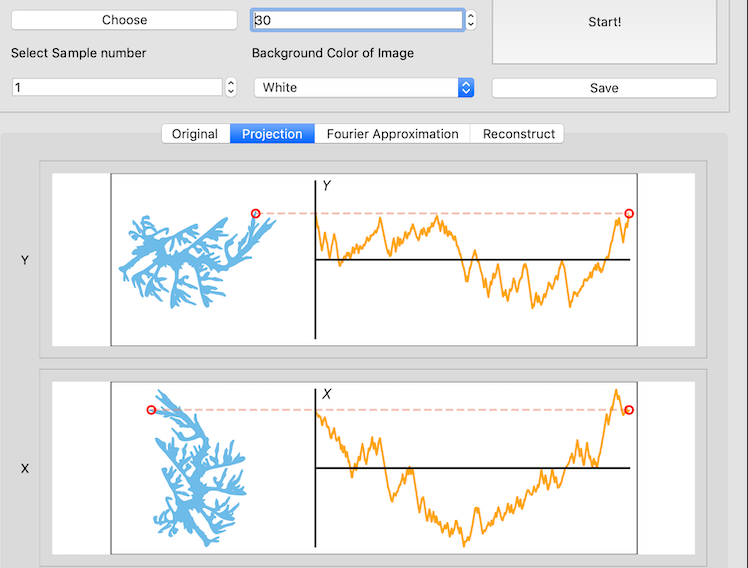
efshape
efshape is a python package for shape analysis of 2D image. The method is based on the combination between ‘Elliptic Fourier Analysis (EFA)’ and ‘Principal Component Analysis (PCA)’. The basic idea is to convert the 2D closed contour into a numeric dataset by EFA and then, the multivariate analysis (PCA) detects the major shape variation of the dataset.
efshape is available at PyPI
Source code is available at Github